

FSRI Lahaina Fire Report Map Illustration
In Maps
Project
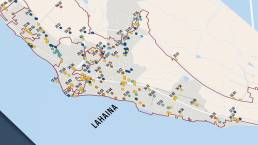
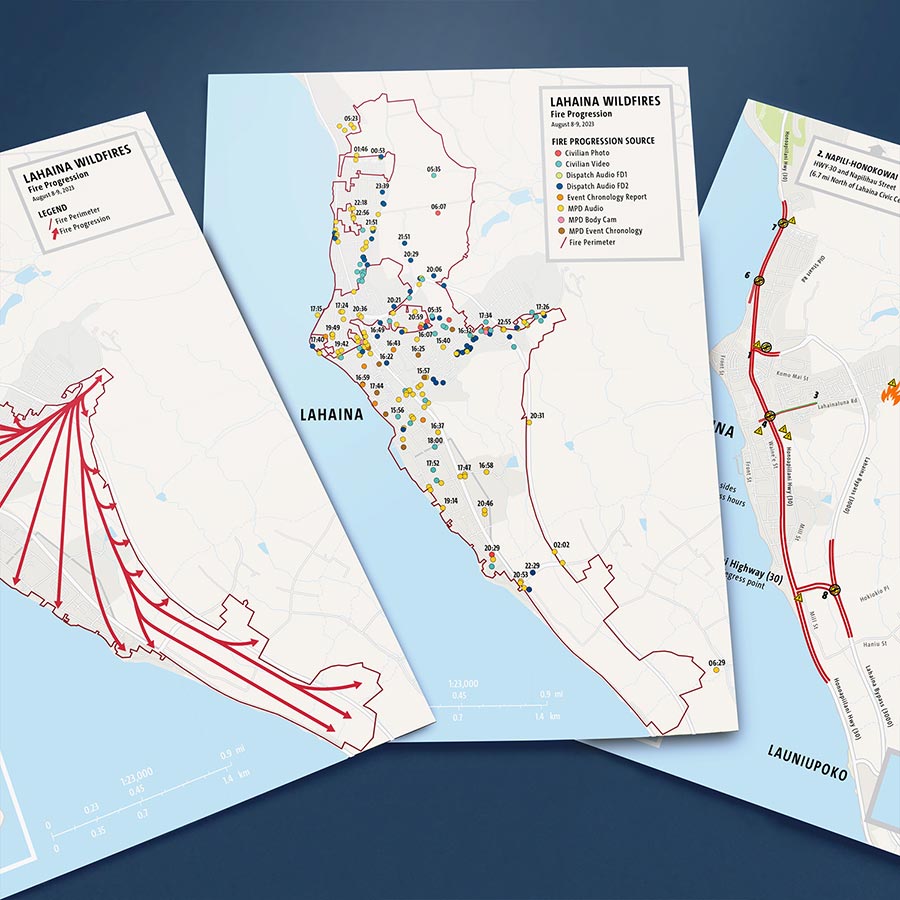
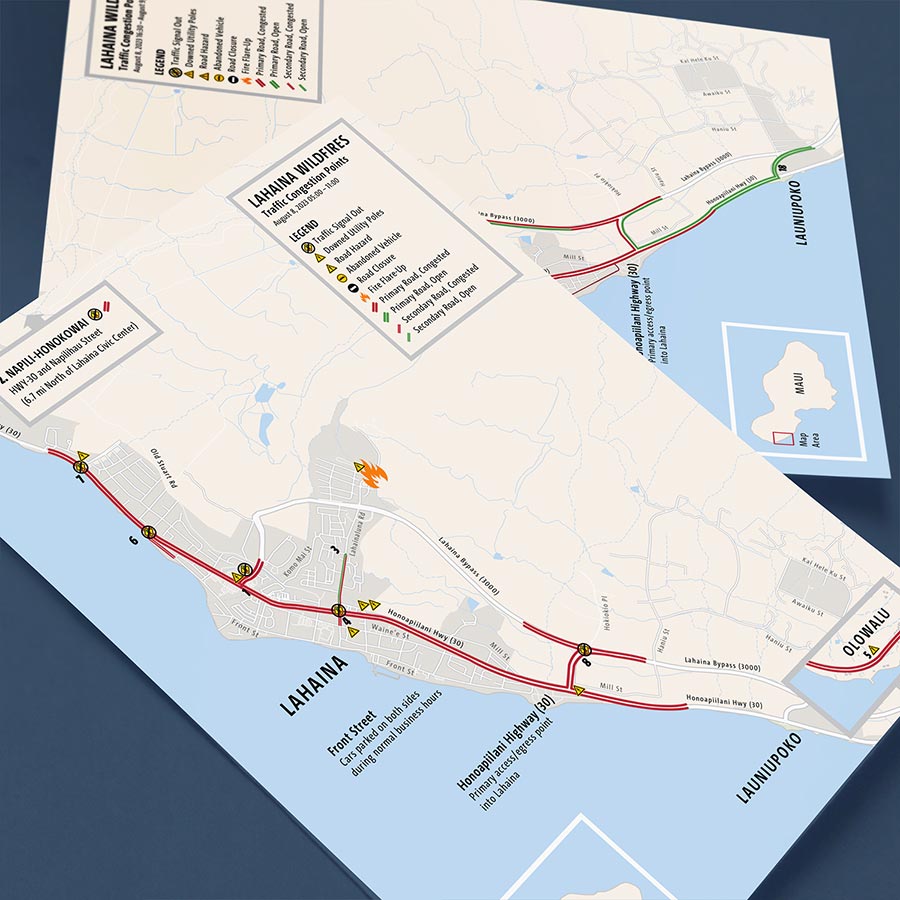
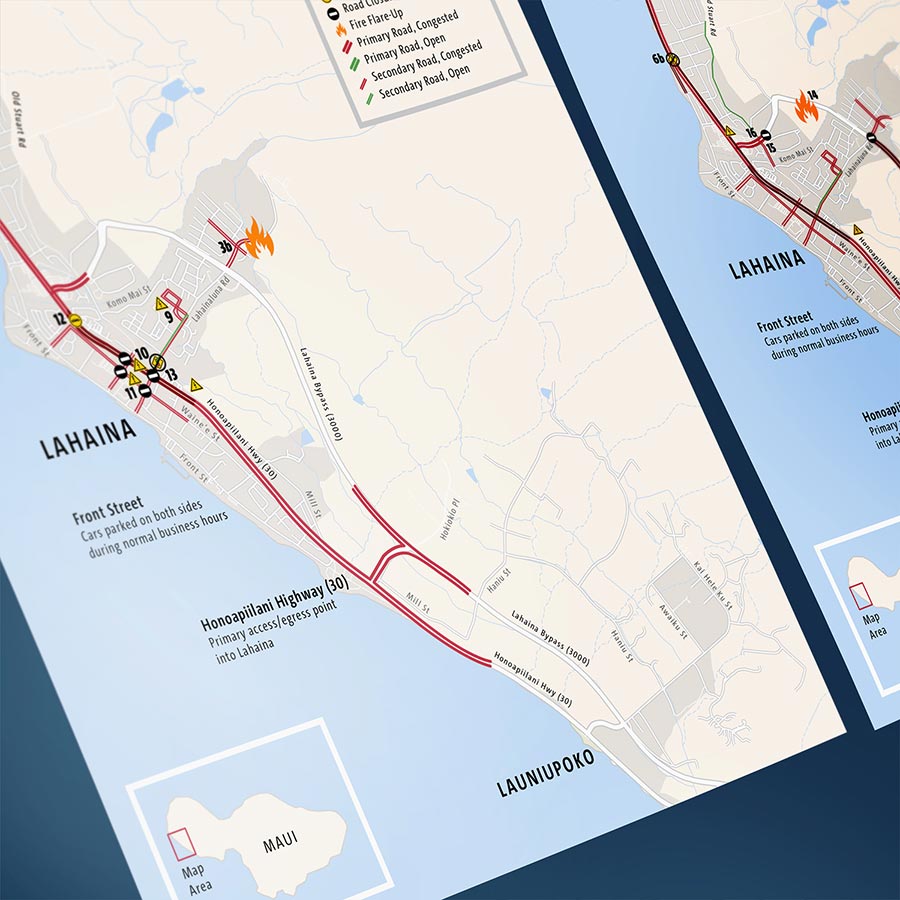
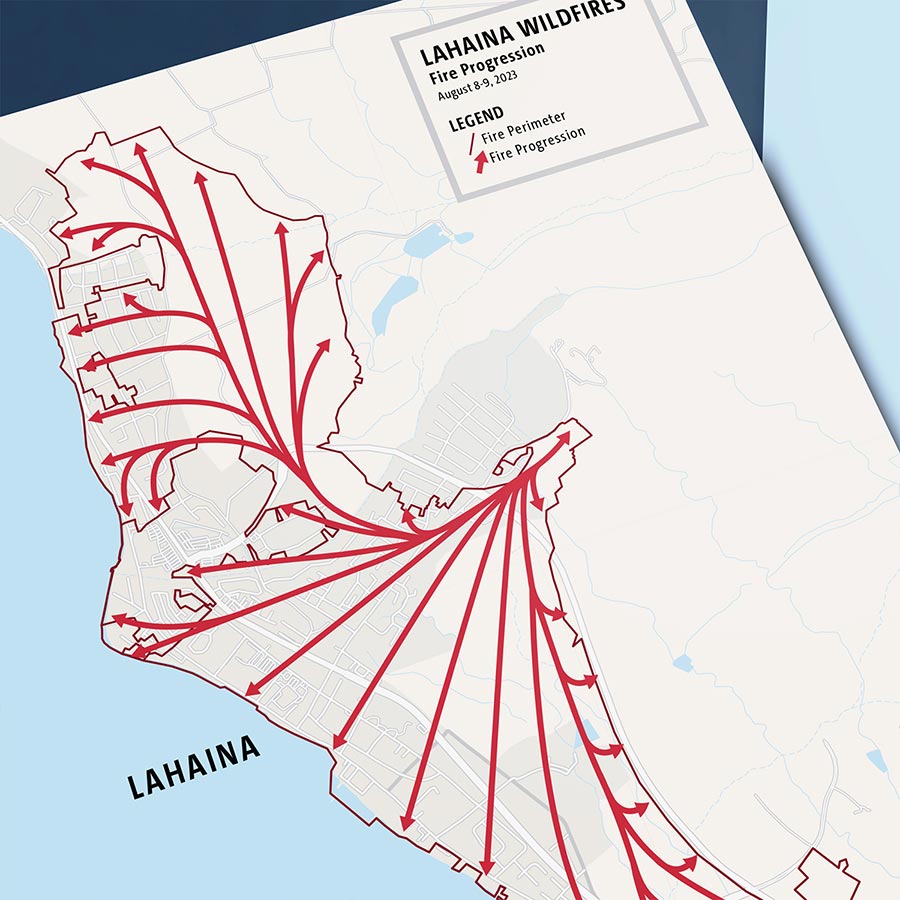
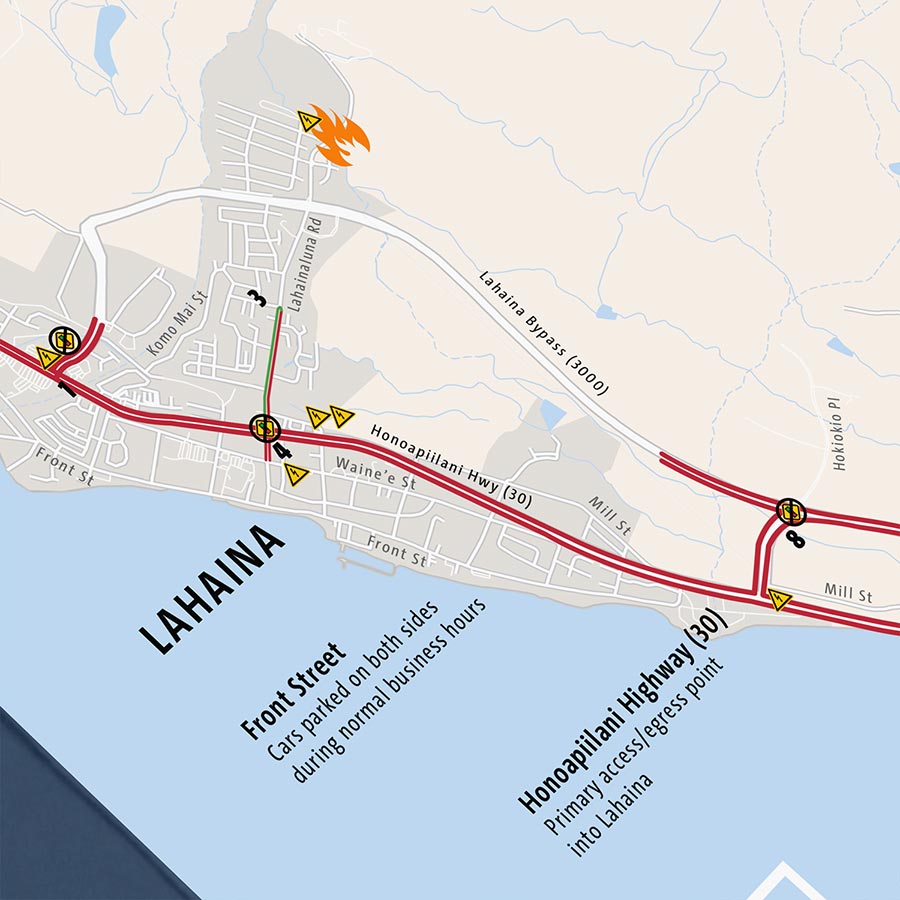
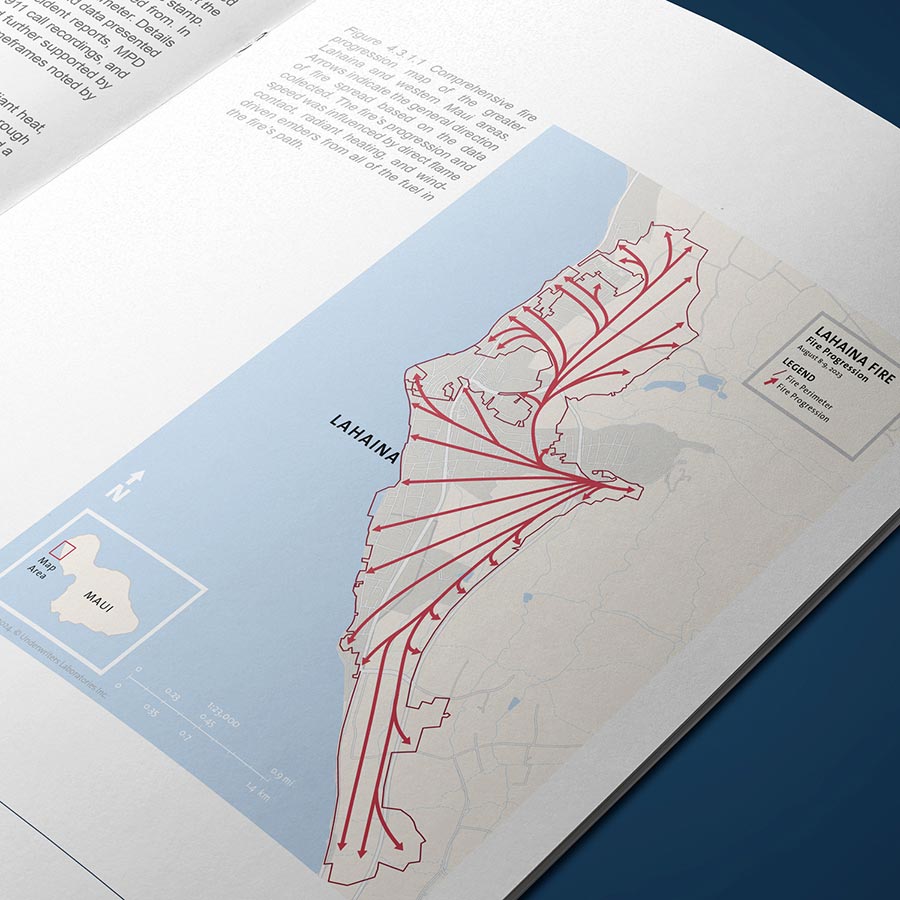
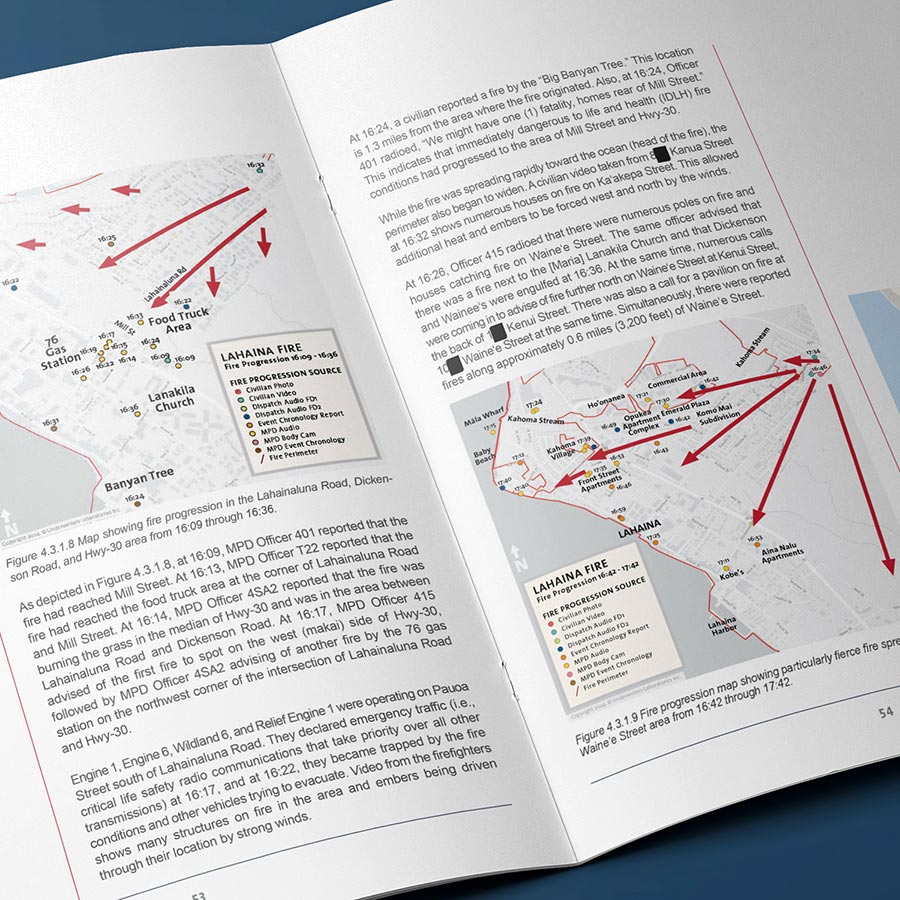
A series of map illustrations for the Fire Safety Research Institute (FSRI) and their timeline report on the 2023 Maui wildfires. I created six pieces (and made style edits to eight more): two fire progression maps that showed what happened—via stylized arrows and then time-stamped data points derived from various sources as the fire happened—and four traffic congestion maps documenting how the fire affected routes in and out of Lahaina. Color and type is based on FSRI’s brand guide, with customized iconography.
I hadn’t made research report maps in many years, so being part of FSRI’s project team was a big help; all the heavy lifting (decisions, data, layout, etc.) had already been done, so for me the most substantial work was methodically picking apart and re-layering the Lahaina quadrangle PDFs (exported from their ESRI source). Not far behind was the quick-turn-fine-tuning I did for eight mini-maps showing details of the fire’s progress, which also ended up in the finished report.
While I’ve done lots of research report design and layout work for nonprofits throughout my career, I didn’t do this one—and it was a nice change to simply supply finished image assets that another designer could use.

Components
Print: Full-color, branded, vector- and pixel-based print-ready versions
Digital: Full-color, branded, carefully-compressed digital PDF versions

FSRI Lahaina Fire Report Map Illustration
A series of map illustrations for the Fire Safety Research Institute (FSRI) and their timeline report on the 2023 Maui wildfires.
ClientFSRIServicesDigital, PrintYear2024Linkfsri.org